After attending seminars by The Teacher Foundation on active learning, I felt motivated to use the think, pair and share strategy in my classroom. I also started introducing some graphic organizers in my classroom teaching because it allows the students to think as they fill in the visual diagram. The link between the verbal and visual information helps students make connections, understand relationships and recall facts based on their prior knowledge.
Initially, it was difficult for me to make groups. Since I was not able to recognize students’ interest and skill level, I randomly mixed up groups. But the result was that few groups came up with better results and other groups lagged behind. Slowly, over the course of a few weeks and sustained use of collaborative strategies I learned how to make groups involving students of mixed skill level and how to manage the class more efficiently.
I had been teaching the concept of diversity in living things, their classification and natural disasters over the week. When it was time for the formative assessments, I decided to use the Venn diagram (graphic organizer) as a formative assessment tool to see where my students stood and to understand if there were any gaps in learning. This tool allowed them to organize information visually and also see the relationship between two items. They would be able to identify similarities and differences.
My objectives for the class were for the students to be able to
- Classify animals as vertebrates and invertebrates, unicellular & multicellular, oviparous and viviparous.
- List the characteristics of animals based on their height, based on their habitat.
- Classify plants based on flowers based on their height, based on their life cycle.
- Organize information in a graphic organizer.
My aim of conducting this activity was also to bring in skills of collaboration and team-work among the students and also to develop their interpersonal communication skills.
In the living world, a lot of diversity is seen in animals and plants. They are classified for the sake of convenience on the basis of similarities and differences in their structure, their organs, and other characteristics.
I gave the class 5 topics and they could choose anyone from them.
- Unicellular and Multicellular organisms
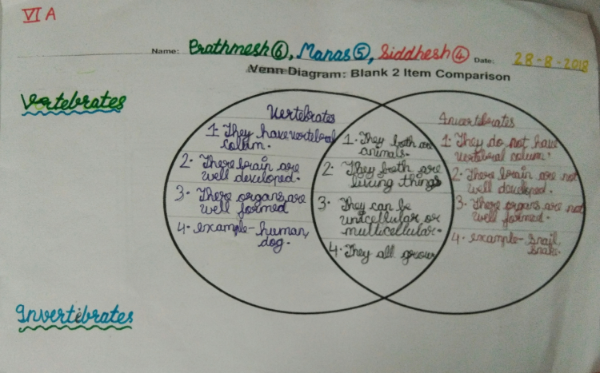
- Vertebrates and Invertebrates
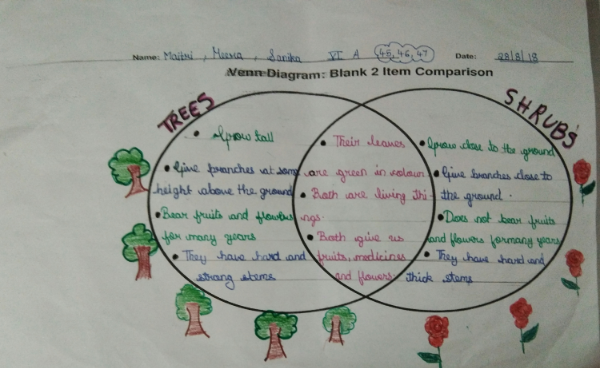
- Trees and Shrubs
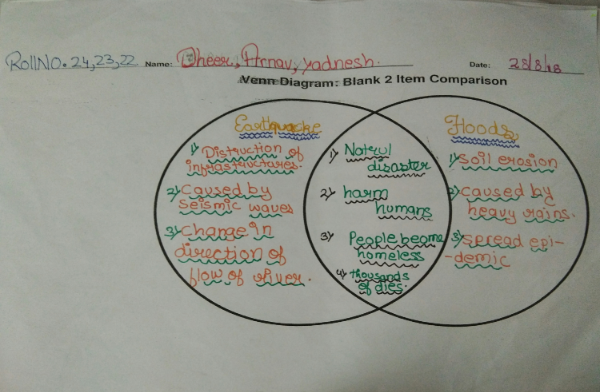
- Earthquakes and Floods
- Storms and forest fire
Before we began I reminded the class of my ground rules which included
- Each and every member of the group should participate.
- Respect everyone’s opinion.
- Take turns to speak one at a time. Each group had 4 children.
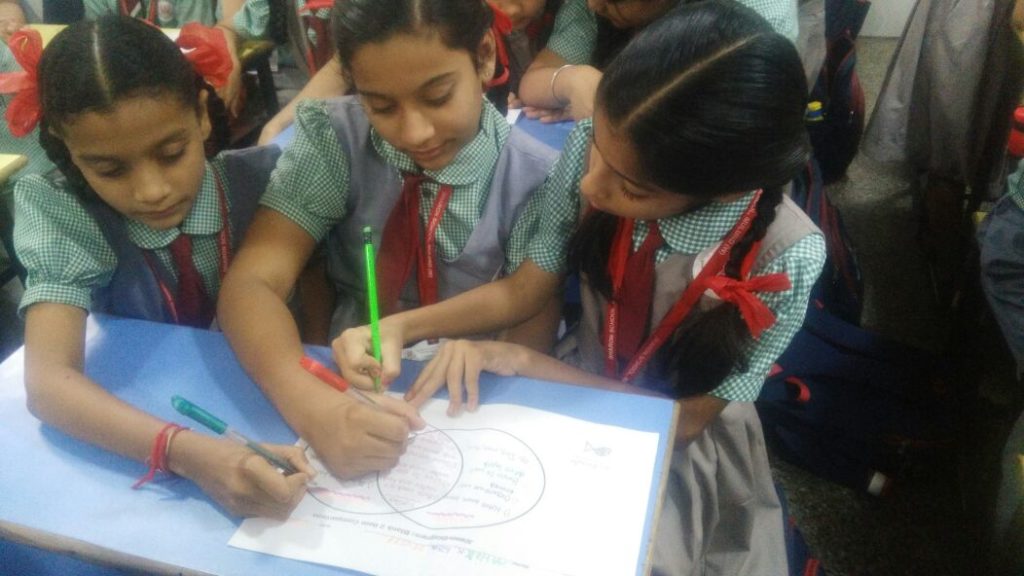
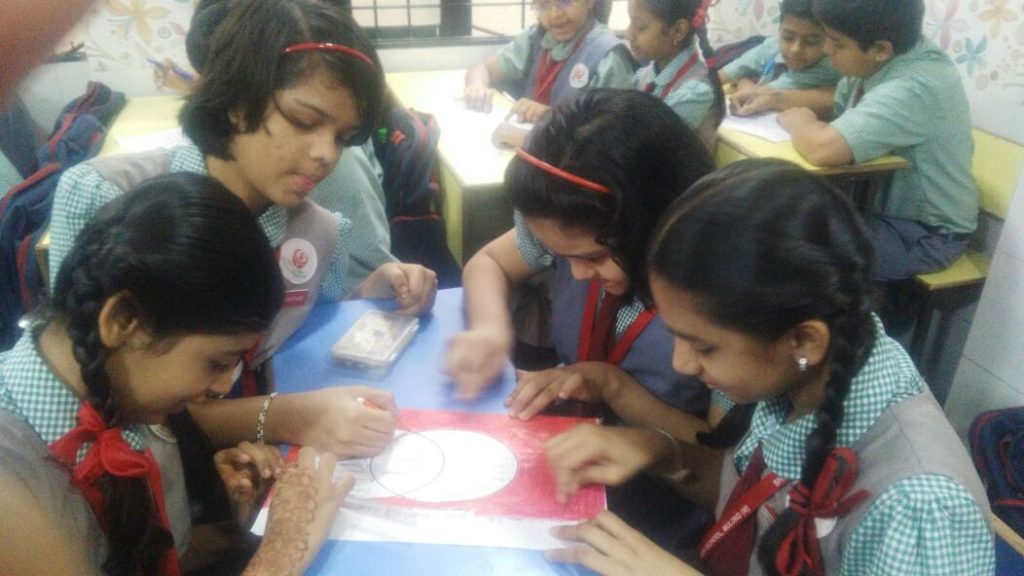
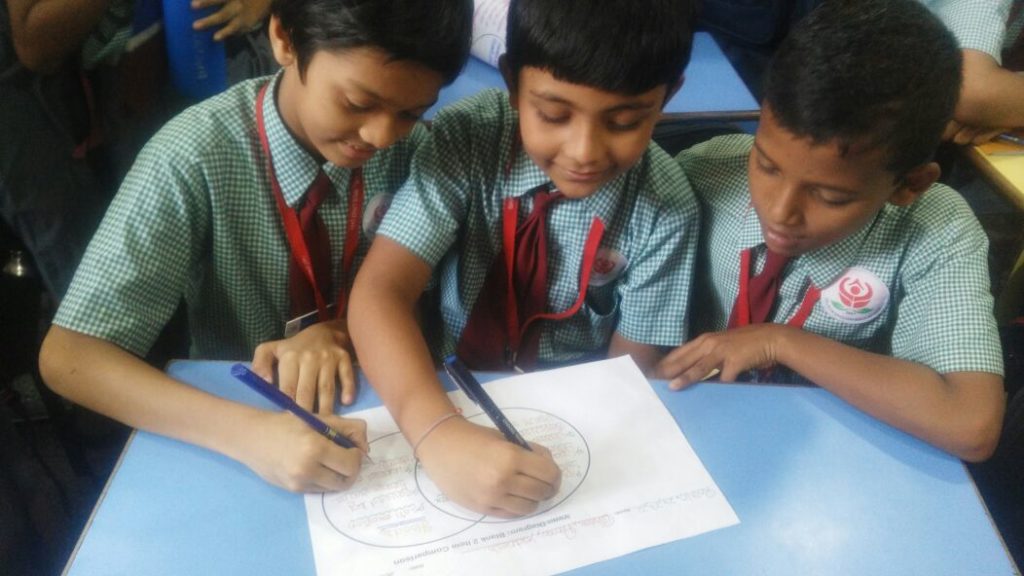
A Venn diagram sheet was given to each group. They had to compare and contrast the topic items that they chose as a group. They were given 5-10 minutes to complete the task. In the first step I had them think individually, then they paired up with another student and in the final step, they shared their ideas in a group.
In the last step, they had to put their ideas in the graphic organizer. They could write the similarities in the part of the circle that overlapped and differences in the other area of the circle (that does not overlap) Thus they could compare and contrast between the two.
As they worked in groups I noticed that the quieter ones were beginning to speak out. My students were learning to communicate well and most importantly self –learning was actually happening in the class. Once they got ready with their points, I asked them to present their ideas in front of the class. Each member of the group would come up and list the similarities and differences about the topic they had chosen. Speaking in front of the class gave them a sense of purpose and a shot of self-confidence.
I realized they had already shared all the points neatly in the Venn diagram sheet and a few more as well. They were able to classify the plants and animal and list their differences and also compare and contrast between the types of disasters.
However, I realized there were certain misconceptions among the students as well. I am listing some here,
- A crab is a vertebrate because it has a hard shell on its back.
- A turtle is an invertebrate.
- Like snakes, earthworms are vertebrates.
In the next class, I clarified their misconceptions through discussion.
- Crabs are crustaceans and they have no spine. So they are invertebrates.
- Sea turtle are reptiles, they have a backbone. The backbone is actually connected to its shell.
- Earthworm is an invertebrate it does not have bones. Snake is a vertebrate it has a bony skeleton and many ribs.
When I went through their presentations. I could see their simple points put forward clearly. I was happy to take my formative assessment using this graphic organizer. As a teacher, I fulfilled my objective and also took small steps to inculcate the values of cooperation and teamwork among my students.
Contributed by Bajana Deepak
STD VI Science Teacher.
This is a very good activity for revision and assessment. The mistakes pointed out are also really important to understand how this tool can be helpful in teaching and assessment.
I would also love to hear from the teachers on the art of pairing. Would be great to have a blog on that. Many an article has been on the difficulty of grouping students. 🙂
Great going Sharon School!